
PyFiber
Python based percent crystallinity tool
PyFiber is an attempt at a user friendly program for determining the percent crystallinity of polymer and polymer nanocomposite fibers. This node based approach is meant to mirror the user experience of parametric equilizers, and supports WAXD data (tested using Rigaku results) and LAMMPS outputs from the XRD package.
Features
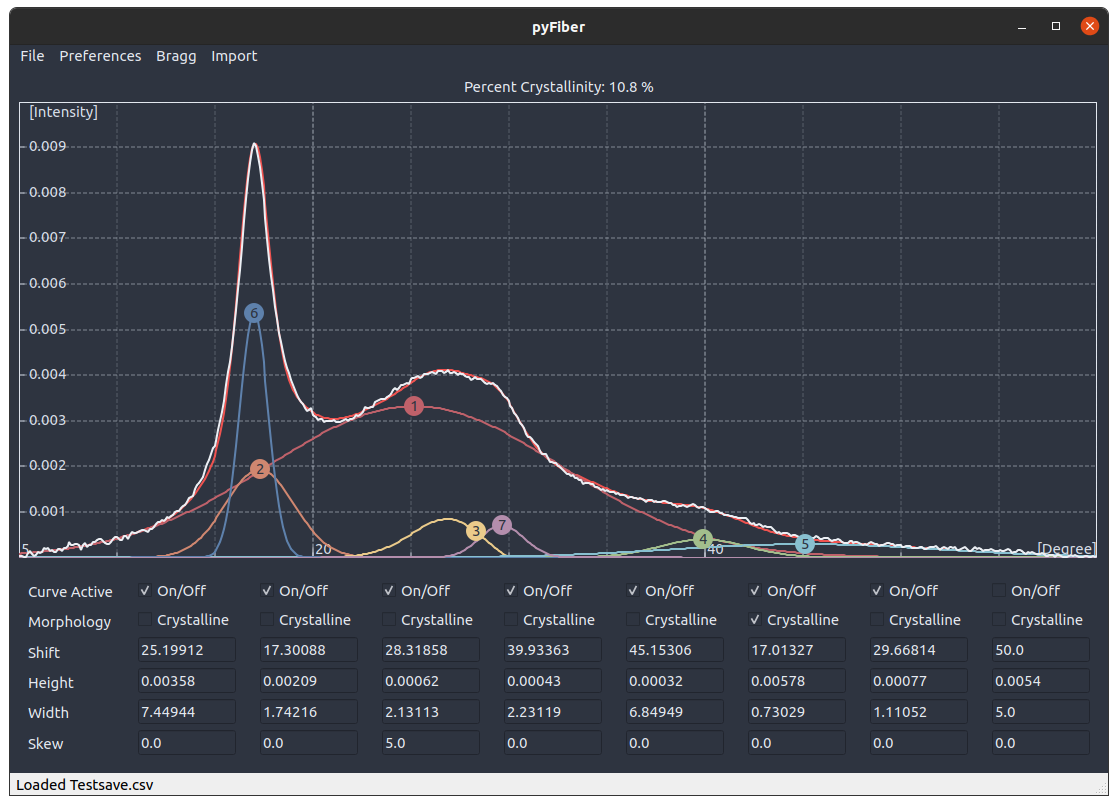
![]() The PyFiber application is meant to aide the curve fitting process for determining the percent crystallinity of polymeric samples. Percent crystallinity is generally measured by decomposing the XRD curve into a series of Gaussian curves, where the percent crystallinity of the sample is considered to be the ratio of areas contributing to the crystal against those contributing to the whole curve, as decribed by (Crystalline Area)/(Total Area)*100%. After performing a fit, the application can save the Gaussian parameters of the fit as .csv files for use in external applications, such as Octave, Matlab, R, or Python for plotting to publication standards. Alternatively, the print function will print a version of the plot window.
The PyFiber application is meant to aide the curve fitting process for determining the percent crystallinity of polymeric samples. Percent crystallinity is generally measured by decomposing the XRD curve into a series of Gaussian curves, where the percent crystallinity of the sample is considered to be the ratio of areas contributing to the crystal against those contributing to the whole curve, as decribed by (Crystalline Area)/(Total Area)*100%. After performing a fit, the application can save the Gaussian parameters of the fit as .csv files for use in external applications, such as Octave, Matlab, R, or Python for plotting to publication standards. Alternatively, the print function will print a version of the plot window.
![]() The PyFiber config file can be modified to best suite your needs within the current build configuration. Options are currently split into the categories global, fittype, angles, theme, and strings directing a LAMMPS 'air' reference and WAXD air reference file.
The PyFiber config file can be modified to best suite your needs within the current build configuration. Options are currently split into the categories global, fittype, angles, theme, and strings directing a LAMMPS 'air' reference and WAXD air reference file.
- Global contains global information, such as refresh rate cap and starting location and size. It also controls how many nodes will be used. Note: If a save file is made with 8 nodes, and the ini is changed to 12, the file should load nodes 1-8 fine. If the node count is reduced to 6, the application will not load nodes 7 and 8.
- Angles describes the behavior of the 2 theta axis (x axis).
- Theme applies globally, and can be flipped between a light and dark theme. A third black on white theme also exists, but is only for printing the plot window to files. These options are also accessable under the 'Preferences' tab in the app.
- Fit Type contains the settings used for the intial fit of the XRD curve. This is still being worked on, but as it stands the XRD curve is decomposed into two curves using an assymetric least squares (als) method. The remaining peaks make up the crystalline regions, and are fit using the total number of nodes - the number specified to belong to the baseline or amorphous curve. The saorphous curve, the underlying one identified and removed by the als method, is fit with the nodes specified in the ini file.
- Under the Bragg tab, HKL indicies can be overlaid on the plotting window using either manual application or by using the built in calculator. The built in calculator supports all Bravais lattice types, and can calculate the proper index 2theta locations based on the Xray wavelength, unit cell dimensions, and primary and secondary HKL planes of interest. The calculator can be left open and new HKL planes can be recommited to the plot window, clearing any previous ones. The Bragg tab also contains an option to clear the window of any plotted indicies.